


Telemetry Logging - It's Here!
June 20, 2022 (updated on 3/23/23)
We are SUPER excited to announce the availability of telemetry logging with the Atlas! It’s been a long time coming, but I think you’re going to like what you see. This blog post is designed to give an overview of how logging works, and how you can use it.
Getting ready
We have to make sure that both your Vakaros Connect app AND your Atlas are on the latest software. Update your phone via your app store, and then let the app update your Atlas as usual. In the end, you should have a connect screen that looks like this:

Next, let’s click on your desired boat profile and make sure logging is on and set the logging rate. Inside of your desired boat profile, click 'Devices' and scroll down to 'Telemetry Logging'. There you will see this screen:

The switch shown is ON. The rates can be set to record all sensor data at 1, 2, 5, or 10 times a second. Use 1 for longer distance races. 5 for detailed analysis. 2 is a great compromise. 10 for hyper-critical work. You’re ready to sail. The Atlas is ALWAYS recording when the switch is on; there is nothing to remember or to forget.
The life of a log
It is instructive to understand how and where logging data lives and exists. Here’s an overview of the 4 places it can exist.
1) In the Atlas. With the setting turned on, the Atlas is ALWAYS recording when the power is on. Every time it is turned on then off, it creates a session. There is nothing to manage here, the Atlas can store hundreds of sessions containing days and days of logging. When the storage is full, it simply overwrites old data.
2) In the Vakaros Connect app. The app provides an easy, graphical way to wirelessly pull your sessions off the Atlas and into the app. Here you can look at them, do some quick on-the-water review, and prep them (trimming etc.) for loading into a more powerful offboard analytics tool.
3) In local device storage as a export. This is simply a file, stored on the phone, designed to be opened by an analytics program. We support several popular formats, with or without compression, and our own special binary VKX format that allows the capture of start times and starting line mark locations.
4) In the analytics app. Of course.
Now let’s go back to the app and see how we get sessions from the Atlas into the app. At the bottom of the home screen of the app, you can see that there are actually 5 tabs that make up the home. The second one (the one you are on) is the device screen. Any devices you have registered will show and be selectable here.


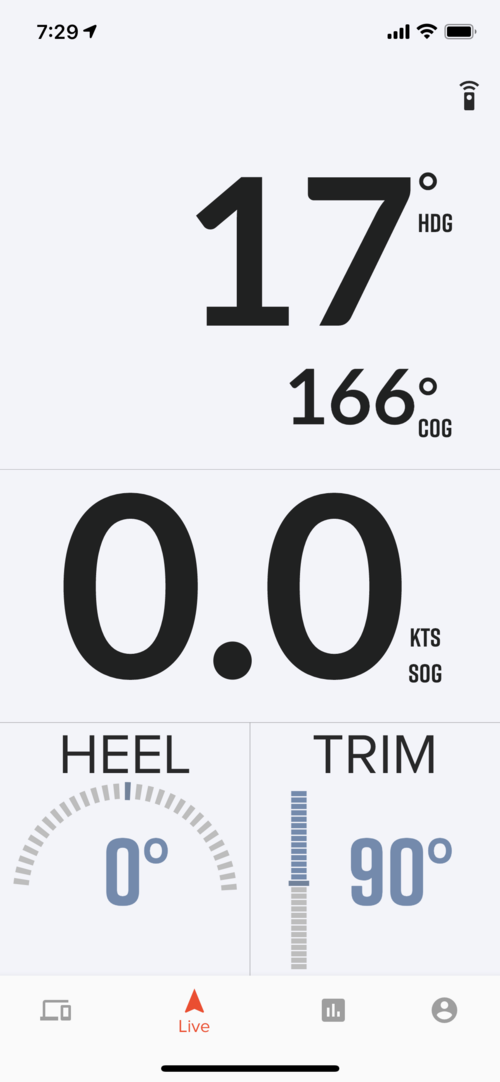
Clicking the third tab is kinda cool, it’s the ‘Live’ screen, a data repeater from the Atlas. Watch this space, we’ll be adding more here soon.

Now comes the fun stuff. Clicking the fourth button leads to the logging screen. It shows the sessions already downloaded to the App (which will be empty the first time in), and a Download button at the top right, which also shows how many un-downloaded sessions the Atlas contains. Here is a screenshot that shows both:

How cool! Love the map that show the session. It’s zoomable and pannable, of course. We’ll come back to this screen, but clicking on the button on the top right allows us to download sessions off the Atlas via Bluetooth. No USB cables needed.
Note there is a session called ‘Live’, that is the session currently being recorded. Yes you can download that (up to that point) at any time! Download times obviously are a function of sample rate and recording length, but normally only take a minute or so for a typical race. Once you download a session, you can forget about it on the Atlas, the device will reuse the space when needed. It will live as long as you want it to in the app.
When you’ve downloaded your sessions, let’s go back the the main logging page. The sessions have been stored on your phone and are visible here. You can scroll through them easily, and clicking on one results in something like this:

Scrolling down reveals some performance controls, allowing you to pinpoint key moments in the race. All this while on your way into the marina!

OK, now let’s export that race so we can see it an analytics program. Selecting export, we can trim off part of the recording we don’t need, select the sensors we want recorded, and the data format of the file.

That takes just a moment, and now you can mail the file, or save it to the phone’s file system so you can open it up with your app. That’s the most common option, and it’s super easy to do.
Now this file can be opened by any local app or web-based system. At launch we are partnering with ChartedSails and SailNjord and the CSV file works with Sailing Performance. Have a look at chartedsails.com and sailnjord.com and https://www.sailingperformance.com/. SailNjord supports our binary format that includes the pinged start line and starting gun time, Chartedsails will as well in the coming days.
I hope you are as excited as we are. The ability to capture ALL sensor data at up to 10Hz, and download it wirelessly to your phone for review and sharing brings an amazing capability to the Atlas. We’re excited for you to share your log details with us!


